
Trend
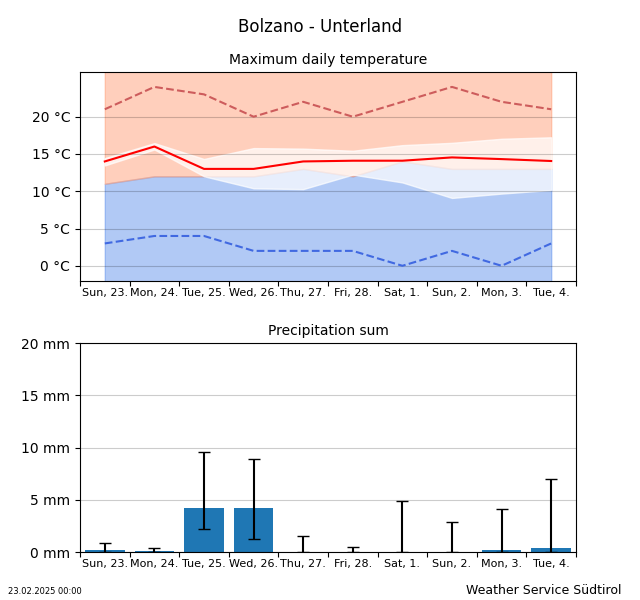
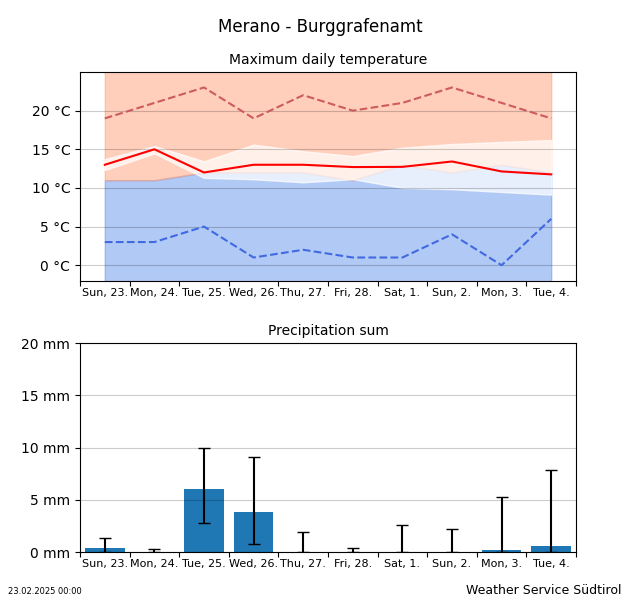
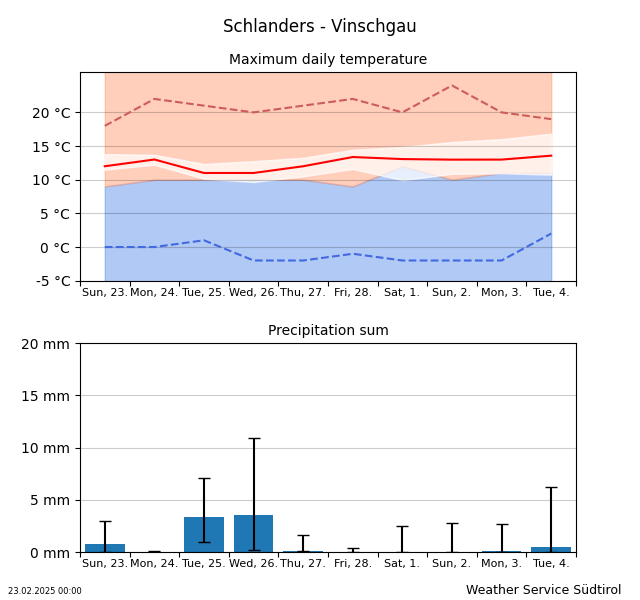
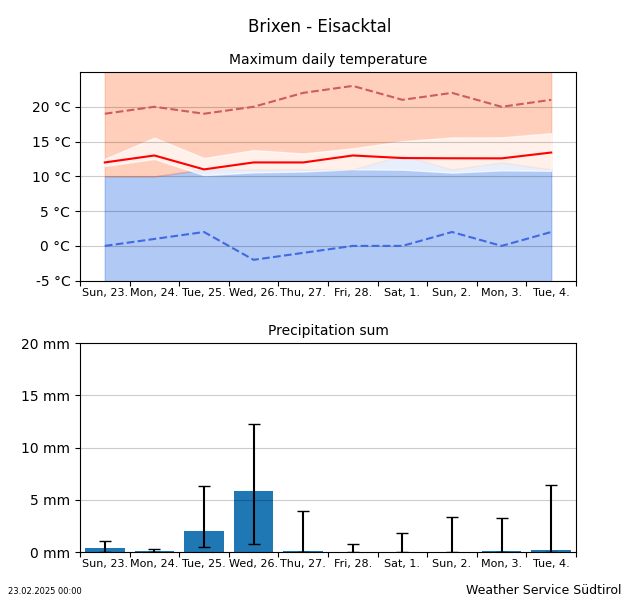
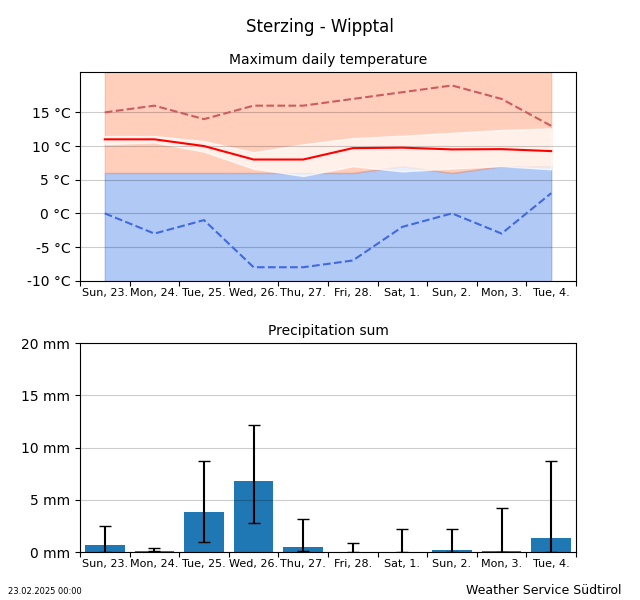
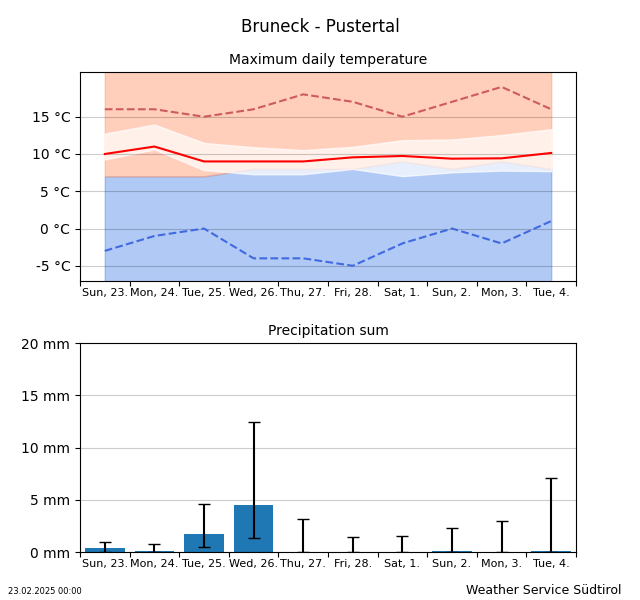
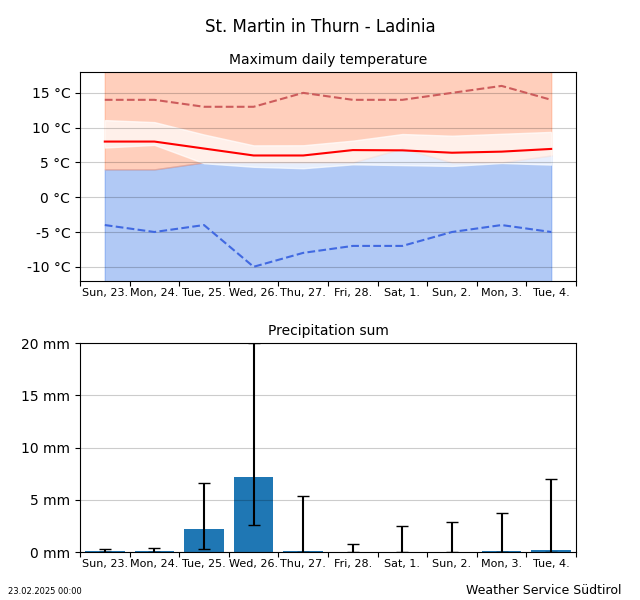
The charts show the trend of the maximum temperature and the daily precipitation in the next ten days for seven districts. Updated three times a day.
 |
Extreme values – highest values since start of records |
 |
Long-term average (1981-2010) |
 |
Trend of Temperature with forecast uncertainity |
 |
Extreme values – lowest values since start of records |
The forecast uncertainty lies within the 10 % and 90 % quantiles.
In the temperature graph, the gray area covers a probability of 80% and the red line shows the most likely development.
In the precipitation graph, the same range is represented by the black vertical line, the blue bar shows the most likely amount of precipitation.


